 Zhida Plastic Machinery
Zhida Plastic Machinery
Zhida Plastic Machinery
China’s plastic manufacturing sector is entering a decisive transition. How To Achieve Sustainable Plastic Manufacturing requires more than replacing virgin resin with recycled pellets. It demands measurable changes across design, sourcing, production, logistics, and product recovery. On a factory floor in Zhejiang or Guangdong, this may mean separating colored scrap at each injection machine. It may also mean installing closed-loop cooling systems and monitoring electricity use hourly.
Ellen MacArthur, a leading circular-economy expert, states, “A circular economy is based on the principles of designing out waste and pollution, keeping products and materials in use, and regenerating natural systems.” Her words offer a practical direction for Chinese manufacturers. Products should be designed for repair, disassembly, and efficient recycling. Suppliers should provide verified recycled-content data. Factories need transparent records for energy, water, emissions, and material losses.
Small changes matter. Better mold design can reduce rejected parts. Cleaner production lines can lower pellet contamination. Renewable electricity can reduce manufacturing emissions, but it is not a complete solution. Transport, chemical additives, and end-of-life collection still require attention. No factory is perfect.
That is the uncomfortable part. Certification alone cannot prove sustainability. A polished report may hide weak waste sorting or excessive water consumption. Responsible companies should publish evidence, accept independent audits, and correct failures openly. This approach builds trust with customers, regulators, workers, and local communities. It also creates a stronger foundation for sustainable plastic production in China.
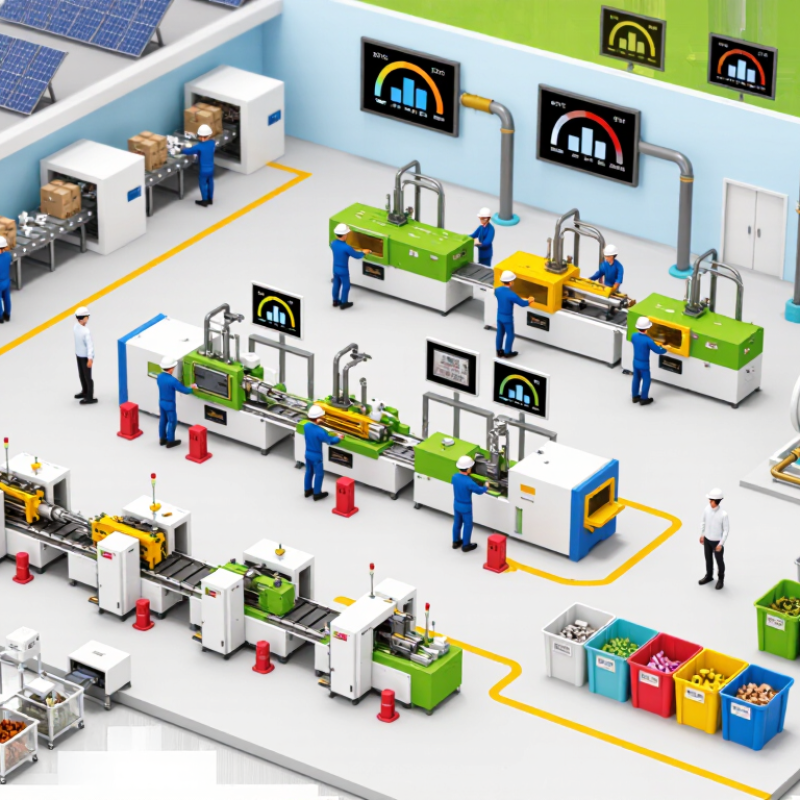
Sustainable plastic manufacturing in China means controlling impacts across the entire product life cycle. It is not simply replacing virgin resin with recycled material. The OECD’s Global Plastics Outlook reports 353 million tonnes of plastic waste worldwide in 2019, while only 9% was recycled. China’s large processing base makes this gap especially important.
A practical definition includes lower-carbon electricity, efficient injection molding, reduced water use, and stable recycled content. National Bureau of Statistics data indicate that China produced roughly 75 million tonnes of plastic products in 2023. At this scale, a factory should record electricity per kilogram, scrap rates, process water, and pellet losses. Small details matter. A warm mold, poor drying, or repeated reprocessing can increase defects and energy demand. Production records should also identify material origin and recovery routes.
Design is part of manufacturing. Products with fewer materials, clear polymer markings, and removable components are easier to sort and recycle. The Ellen MacArthur Foundation has repeatedly shown that circular systems require design changes, not only better waste collection. Yet this definition is not perfect. Recycled polymers may vary in quality, and low-carbon electricity is not available equally across regions. Manufacturers should disclose these limits instead of presenting every recycled product as automatically sustainable. Independent audits, supplier data, and measured factory performance provide stronger evidence than environmental claims alone.
| Sustainability Dimension | Real Data Point or KPI | Definition and Calculation | Practical Application in China | Relevant Reference |
|---|---|---|---|---|
| Policy and Compliance | 2021–2025 national plastic-pollution control period | China's plastic-pollution control framework for the 14th Five-Year Plan period focuses on reducing unnecessary plastic use, improving collection and recycling systems, and controlling plastic leakage into the environment. | Manufacturers should maintain a legal register covering production, packaging, waste management, recycled materials, restricted products, and local implementation requirements. | China Action Plan for Plastic Pollution Control |
| Material Efficiency | Material yield (%) | Material yield = finished-good mass ÷ total polymer input mass × 100. Process scrap, start-up purge, rejected parts, and regrind should be recorded separately. | Use process controls, optimized mold design, closed-loop regrind where technically suitable, and production planning to reduce avoidable resin loss. | ISO 14051:2011, Material Flow Cost Accounting |
| Recycled Content | Post-consumer recycled content (%) | Post-consumer recycled content = certified post-consumer recycled polymer input ÷ total polymer input × 100. Pre-consumer scrap should not be reported as post-consumer material. | Set product-specific targets according to safety, performance, food-contact, medical, and customer requirements. Keep supplier declarations, batch records, and mass-balance evidence. | ISO 14021:2016; applicable China GB 4806 food-contact standards |
| Product Circularity | Recyclability assessment (%) | Recyclability should consider polymer identification, additives, pigments, labels, closures, material separation, collection availability, sorting, and economically viable recycling routes. | Prefer mono-material structures where feasible, clearly identify polymer types, avoid incompatible combinations, and provide dismantling or recycling information for commercial products. | ISO 18604:2013, Packaging and the Environment—Material Recycling |
| Energy Management | Energy intensity (kWh/kg) | Energy intensity = total electricity and fuel energy consumed by the manufacturing process ÷ saleable plastic output. Report electricity, natural gas, steam, and other fuels separately before conversion. | Track injection molding, extrusion, blow molding, drying, compressed air, cooling, and auxiliary equipment as separate energy-use categories. | ISO 50001:2018, Energy Management Systems |
| Climate Impact | Product carbon footprint (kg CO₂e/kg) | Product carbon footprint = total greenhouse-gas emissions attributable to defined life-cycle stages ÷ product mass. The boundary must state whether it is cradle-to-gate or includes later stages. | Use measured energy data, verified emission factors, resin-production data, transport distances, recycled-content data, and documented allocation rules. | ISO 14067:2018; ISO 14064-1:2018 |
| Renewable Electricity | Renewable electricity share (%) | Renewable electricity share = qualifying renewable electricity consumed ÷ total electricity consumed × 100. Avoid double counting between on-site generation, contracts, and certificates. | Record on-site solar generation, purchased renewable electricity, and relevant electricity certificates separately. Report the accounting method and evidence period. | GHG Protocol Scope 2 Guidance |
| Water Stewardship | Water consumption intensity (m³/tonne) | Water consumption intensity = water consumed or withdrawn, according to the selected boundary, ÷ saleable output in tonnes. Disclose withdrawal, discharge, reuse, and source separately. | Prioritize cooling-water recirculation, leak detection, closed-loop systems, and treatment of process wastewater before discharge. | ISO 14046:2014, Water Footprint |
| Waste and Circular Operations | Waste diversion rate (%) | Waste diversion rate = mass sent for recycling, reuse, recovery, or other documented non-disposal treatment ÷ total generated waste × 100. | Separate clean plastic scrap, contaminated plastic, hazardous waste, packaging waste, sludge, and general waste. Retain transfer records and licensed-contractor documentation. | China Solid Waste Pollution Prevention and Control Law; ISO 14001:2015 |
| Hazardous Substances | Restricted-substance conformity (%) | Conformity rate = tested or documented material lots meeting applicable legal and customer restrictions ÷ total lots assessed × 100. | Control additives, pigments, plasticizers, heavy metals, residual monomers, and other substances according to the intended application and applicable Chinese product standards. | GB 4806 series for food-contact materials; applicable chemical and waste regulations |
| Chemical and Process Safety | Process incident frequency | Record spills, uncontrolled releases, fires, explosions, occupational incidents, and near misses using a consistent reporting period and exposure basis. | Maintain chemical inventories, safety data sheets, storage controls, emergency procedures, ventilation, worker training, and preventive-maintenance records. | ISO 45001:2018; ISO 14001:2015 |
| Supply-Chain Traceability | Traceable resin volume (%) | Traceable resin volume = polymer input supported by supplier, batch, origin, specification, and quantity records ÷ total polymer input × 100. | Use purchase orders, certificates of analysis, recycled-content declarations, incoming inspection records, and batch-level production records. | ISO 22095:2020, Chain of Custody |
| Environmental Management | Certified environmental management coverage (%) | Coverage = production sites or operational activities managed under a documented environmental management system ÷ total relevant sites or activities × 100. | Define environmental objectives, compliance controls, operational procedures, internal audits, corrective actions, and management reviews for each manufacturing site. | ISO 14001:2015, Environmental Management Systems |
| Life-Cycle Design | Life-cycle assessment coverage | Document material extraction, resin production, manufacturing, transport, use assumptions, end-of-life scenarios, and the functional unit. Avoid comparing products with different functions or boundaries. | Use life-cycle assessment to compare lightweighting, recycled resin, mono-material design, process-energy improvements, reuse systems, and alternative end-of-life routes. | ISO 14040:2006; ISO 14044:2006 |
It controls impacts across the product’s entire life cycle. It includes materials, energy, water, waste, transport, and disposal. Replacing virgin resin alone is not enough.
Track electricity per kilogram, scrap rates, process water, and pellet losses. Record material origins and recovery routes. Small records expose hidden waste.
No. Recycled resin may vary in color, strength, and contamination risk. Engineers should test every batch before production. Cheap substitutions can increase rejects and energy use. This assumption needs scrutiny.
Use fewer materials and clearly marked polymer types. Make components removable when practical. Simple structures are easier to sort and recycle. Design still gets overlooked.
Measure electricity at individual machines. Check heating losses, compressed-air leaks, and shutdown waste. Efficient equipment helps, but poor process control remains costly. Measure it.
No. It can lower electricity-related emissions, but it cannot fix inefficient molding. Emissions should also include resin production, transport, and disposal. Carbon figures may remain incomplete.
Closed-loop cooling can reduce freshwater demand. Filtration can help prevent microplastic discharge. Audits should check wastewater, cooling systems, and maintenance records. The system may still leak.
Use independent audits, supplier records, and measured factory performance. Check whether recycling figures include contaminated losses. Impressive percentages can hide excluded waste. Data can mislead.
How To Achieve Sustainable Plastic Manufacturing in China requires a balanced approach that reduces environmental impact while maintaining product quality and economic efficiency. Manufacturers should begin by evaluating material selection, energy consumption, emissions, and production waste across the entire manufacturing process. Using recycled or bio-based inputs where appropriate, improving equipment efficiency, and adopting cleaner production technologies can help reduce dependence on virgin resources and lower carbon emissions. Circular design principles, such as durability, easy disassembly, and recyclability, should also guide product development.
A strong recycling and waste management system is essential for recovering valuable materials and preventing plastic waste from entering the environment. Companies can improve traceability, supplier standards, and resource management through coordinated supply chains and reliable data systems. Compliance with applicable environmental requirements, employee training, transparent reporting, and cooperation among manufacturers, recyclers, researchers, and industry organizations can further strengthen progress. Together, these measures support a practical transition toward responsible, resource-efficient, and resilient plastic manufacturing.
