Zhida Plastic Machinery Zhida Plastic Machinery

What Is the Best Way to Optimize Plastic Production Lines?

Time:2026-10-05 Author:Madeline
0%

What Is the Best Way to Optimize Plastic Production Lines? The answer begins with measurement, not guesswork. PlasticsEurope’s Plastics—The Fast Facts 2024 reports global plastics production reached 413.8 million tonnes in 2023. This scale increases pressure on manufacturers to reduce scrap, energy use, and unplanned downtime. Every wasted kilogram matters.

How To Optimize Plastic Production Lines requires a connected view of the entire process. Start by tracking OEE, cycle time, melt temperature, pressure stability, changeover duration, and scrap by defect type. The U.S. Department of Energy identifies motor systems, heating, compressed air, and process controls as major industrial energy opportunities. A line may run quickly, yet consume excessive energy per kilogram. That result deserves scrutiny.

Tim Osswald, a leading polymer-processing expert, describes polymer processing as “the science and art of transforming polymers into useful products.” His statement remains practical. Optimization needs engineering discipline and shop-floor judgment. Sensors can reveal pressure drift, but experienced operators often explain its cause. Standardized recipes, preventive maintenance, closed-loop temperature control, and disciplined material drying create measurable gains. Small changes compound.

Still, no production line is perfectly optimized. A lower scrap rate may hide slower output. A faster cycle may create weaker parts. Managers should validate improvements through controlled trials, product testing, and reliable baseline data. The best solution is not always the newest machine. Often, it is a clearer process, better feedback, and one overlooked setting corrected.
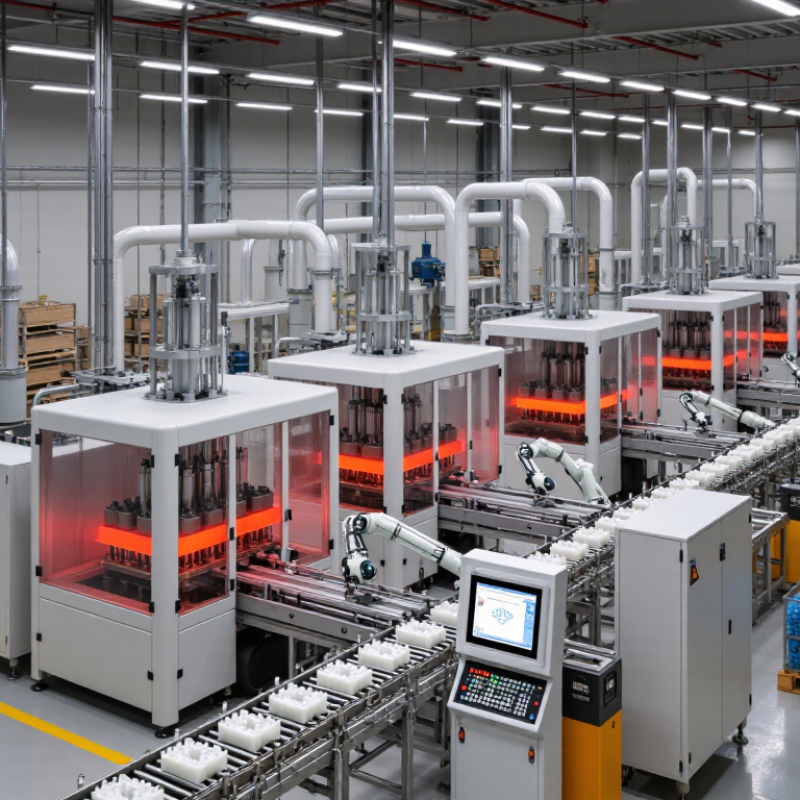
What Is the Best Way to Optimize Plastic Production Lines?

Defining the Goals of Plastic Production Line Optimization

What Is the Best Way to Optimize Plastic Production Lines?

Defining the Goals of Plastic Production Line Optimization

Optimization should begin with a measurable production problem, not a fashionable technology. Set targets for output, first-pass yield, energy use, changeover time, and unplanned downtime. The OECD Global Plastics Outlook reports that global plastics production increased from 234 million tonnes in 2000 to 460 million tonnes in 2019. This growth makes disciplined efficiency goals increasingly important.

Start with a baseline from actual shifts. Record cycle time, scrap weight, moisture, melt temperature, and rejected parts beside each machine. A dashboard showing 82% availability may hide frequent short stops. The U.S. Department of Energy notes that compressed-air leaks can waste 20–30% of compressor output. Check hissing fittings during a quiet night shift. Small losses become expensive when equipment runs continuously.

The goal must fit the product and process. A 10% speed increase is not valuable if warpage doubles. Define acceptable limits for dimensional variation, surface defects, and material loss before changing settings. Energy targets also need context; colder weather, recycled feedstock, and frequent color changes can distort comparisons. The International Energy Agency identifies the chemical sector as a major industrial energy consumer, so energy per kilogram deserves close attention. Yet this metric can mislead when lightweight products increase output without increasing weight. Review the assumptions. A perfect target may still be the wrong target.

Assessing Equipment, Materials, Energy Use, and Process Performance

What Is the Best Way to Optimize Plastic Production Lines?

Assessing Equipment, Materials, Energy Use, and Process Performance

Optimizing a plastic production line starts with evidence, not assumptions. Inspect screw wear, barrel temperature stability, cooling capacity, and sensor calibration. A worn screw can increase residence time and produce uneven melt quality. Measure output hourly, then compare it with pressure, torque, and reject records. Small deviations often appear before visible defects. Not every machine needs replacement. Sometimes, maintenance is the higher-value intervention.

Material selection should match product requirements, drying behavior, and recycled content limits. Record moisture before processing, especially with hygroscopic polymers. A few damp pellets can cause bubbles, streaks, or brittle parts. Keep batches traceable, but do not treat supplier data as perfect. Test melt flow and moisture at defined intervals. This adds discipline. Operators sometimes adjust temperatures repeatedly when inconsistent feedstock causes the real problem.

Energy optimization needs more than watching total electricity use. Track kilowatt-hours per kilogram, heater cycling, compressed-air leaks, and cooling demand. Insulation, stable cooling water, and shorter idle periods can reduce waste. Process performance should include cycle time, first-pass yield, downtime, and dimensional variation. Set control limits and review trends every shift. Measure twice. Perfect settings are rarely permanent. A faster cycle may increase rejects, making the line appear efficient while losing usable material. That uncomfortable finding deserves a proper trial, not a quick adjustment.

Improving Automation, Workflow Control, and Production Consistency

A reliable plastic production line begins with visible control, not faster machines. Automation should connect material feeding, heating, molding, cooling, and inspection. Sensors can track melt temperature, pressure, cycle time, and motor load. The control system should show trends on one clear screen. Operators need alarms that explain the problem. “Temperature high” is less useful than “zone three, 8°C above target.” Small details matter. They shorten diagnosis and reduce rushed adjustments. Use recipes with locked limits, but allow authorized changes when conditions shift. Resin moisture, room temperature, and recycled content can alter behavior. Ignoring them creates false consistency.

Workflow control improves when every handoff has a defined signal. A batch should carry its material code, recipe version, start time, and inspection results. Visual scheduling helps operators see waiting molds, maintenance needs, and quality holds. Simple digital records also reveal repeated delays.

In a practical line review, minutes may disappear through manual data entry, not equipment failure. That sounds minor. Across many cycles, it becomes a serious capacity loss. Standard work instructions should sit near the machine, with photos of acceptable parts. Still, instructions require regular review. A perfect procedure on paper may fail during a real shift.

Tips: Keep critical alarms few and specific. Check sensors against a trusted reference on a fixed schedule. Measure scrap by cause, not only by weight. Compare cycle variation across shifts. Invite operators to challenge settings. Their practical warnings often arrive before the dashboard. Do not automate a confusing workflow. Clarify it first.

Applying Quality Assurance, Predictive Maintenance, and Waste Reduction

What Is the Best Way to Optimize Plastic Production Lines?

Applying Quality Assurance, Predictive Maintenance, and Waste Reduction

An optimized plastic production line begins with disciplined quality assurance, not faster machine settings. Operators should check resin moisture, melt temperature, pressure, and part weight at defined intervals. A simple control chart can reveal drift before customers see warped edges or weak seams. Keep samples from each shift. They provide physical evidence when digital records look normal. In practice, inspection rules often fail when they are too complicated. A checklist that takes three minutes is more useful than an ideal procedure nobody follows.

Quality Assurance Operators should check resin moisture, melt temperature, pressure, and part weight at defined intervals.

Predictive maintenance adds another layer of control. Sensors can track motor vibration, bearing temperature, hydraulic pressure, and cycle-time changes. Engineers should compare these readings with historical operating data, rather than trust a single alarm. A gradual rise in vibration may justify cleaning, lubrication, or planned bearing replacement during a scheduled stop. The line keeps running. Yet prediction is not magic. Poor sensor placement, missing records, and rushed interpretations can create false confidence. Maintenance teams need clear thresholds, inspection notes, and human review before changing production plans.

Waste Reduction Regrind, start-up scrap, rejected parts, and purge material should be measured by machine, mold, shift, and cause.

Waste reduction should connect directly to these practices. Regrind, start-up scrap, rejected parts, and purge material should be measured by machine, mold, shift, and cause. When a color change creates 18 kilograms of purge waste, the team can test smaller purge volumes and better sequencing. Reusing material may help, but excessive regrind can affect strength or appearance. That trade-off deserves testing, not assumptions. Production teams sometimes celebrate lower scrap while overlooking longer changeovers and hidden energy use. A better review checks yield, downtime, energy, and product performance together.

Measuring Results and Continuously Refining Line Performance

Optimizing a plastic production line starts with measurement, not a faster machine. Record cycle time, scrap, changeover minutes, energy per kilogram, and unplanned stops every shift. Use ISO 22400 definitions so operators and engineers calculate KPIs consistently. A useful OEE record separates availability, performance, and quality. Show every stop.

The scale makes small losses expensive. Plastics Europe reported 413.8 million tonnes of global plastics production in 2023. On a line making 500 kilograms hourly, a 6% scrap rate wastes 30 kilograms each hour. Convert that loss into material, labor, and energy cost. U.S. Department of Energy guidance says compressed-air leaks can waste 20–30% of compressor output. A pressure trend, ultrasonic leak survey, and kilowatt-hour-per-kilogram check can expose that loss. Measure before and after one change.

Refinement should be controlled, not dramatic. Change one setting, such as melt temperature or cooling time, then compare matched production runs. Keep resin grade, mold, operator, and order mix visible in the record. Our first dashboard looked impressive but mixed startup scrap with normal production. That mistake distorted the baseline. Review it openly. Use weekly Pareto charts for downtime and scrap, then assign owners and due dates. If a gain disappears after two weeks, treat it as an unfinished experiment. The next audit should test whether the improvement survives a full changeover.

FAQS

What should be the starting point for optimizing a plastic production line?

Begin with a measurable problem, such as low output, high scrap, energy waste, or frequent downtime. Record actual shift data before changing equipment settings. Measure twice.

Which production metrics should operators track?

Track cycle time, first-pass yield, energy per kilogram, changeover time, and unplanned downtime. Also record moisture, melt temperature, scrap weight, and rejected parts. Averages can hide short stops.

How can equipment condition affect plastic production?

Inspect screw wear, barrel temperature stability, cooling capacity, and sensor calibration. A worn screw may increase residence time and create uneven melt quality. Replacement is not always necessary. Maintenance may provide better value.

How should material quality be controlled?

Match each material to product requirements, drying behavior, and recycled-content limits. Check moisture before processing hygroscopic polymers. Damp pellets can cause bubbles, streaks, or brittle parts. Supplier information needs verification.

How can energy waste be reduced?

Track electricity per kilogram, heater cycling, cooling demand, and compressed-air losses. Listen for hissing fittings during a quiet shift. Insulation, stable cooling water, and shorter idle periods may reduce consumption. The lowest energy figure is not always the best target.

What quality checks should be performed during production?

Check resin moisture, melt temperature, pressure, part weight, and dimensions at fixed intervals. Use simple control charts to identify process drift. Keep physical samples from every shift. Digital records can look normal while parts change.

How does predictive maintenance support line performance?

Monitor vibration, bearing temperature, hydraulic pressure, and cycle-time changes. Compare readings with historical trends instead of trusting one alarm. A gradual vibration increase may support planned bearing replacement. Prediction is not magic.

How can plastic production waste be reduced safely?

Measure regrind, start-up scrap, rejected parts, and purge material by machine, mold, shift, and cause. For example, an 18-kilogram purge loss may justify testing smaller purge volumes. Excessive regrind can affect strength or appearance. Test the trade-off.

Why should production teams test process changes before adopting them?

A faster cycle may increase warpage, rejects, or hidden energy use. Compare output, yield, downtime, energy, dimensions, and material loss during controlled trials. Some improvements look good briefly. Review the uncomfortable findings.

Conclusion

Optimizing a plastic production line begins with clearly defining goals such as higher output, consistent product quality, lower operating costs, improved safety, and reduced environmental impact. How To Optimize Plastic Production Lines effectively requires a complete assessment of equipment condition, material usage, energy consumption, cycle times, and process performance. This evaluation helps identify bottlenecks, unnecessary losses, and opportunities for improvement.

The next steps include strengthening automation, improving workflow control, and standardizing operating procedures to achieve stable production results. Quality assurance systems should monitor critical process conditions and product specifications, while predictive maintenance can identify equipment issues before they cause unplanned downtime. Waste reduction can be supported through better material handling, accurate process settings, and the reuse or responsible management of suitable production scrap. Finally, performance should be measured through clear indicators such as yield, downtime, energy use, defect rates, and overall equipment effectiveness. Regular reviews and continuous adjustments help maintain efficient, reliable, and adaptable production.

Madeline

Madeline

Madeline is a dedicated marketing professional with a wealth of expertise in our company's core offerings. With a keen understanding of the industry, she brings a unique perspective to her role, consistently delivering high-quality content that highlights the superior aspects of our products. As......