Zhida Plastic Machinery
Zhida Plastic Machinery
Zhida Plastic Machinery
2026 Top Energy Management Strategies for Plastic Factories begins with a practical question: where does energy disappear during production? In a plastic factory, electricity may flow through injection molding machines, extruders, chillers, compressors, dryers, and ventilation systems. A warm motor casing, a leaking air line, or an idle heater can reveal hidden waste. These details matter because small losses repeat across every shift.
Energy expert Amory Lovins, co-founder of Rocky Mountain Institute, said, “The cheapest, cleanest, and safest energy is the energy we don’t use.” His principle provides a strong foundation for Plastic Factory Energy Management Strategies. Factories can begin with submetering, equipment-level audits, variable-speed drives, heat recovery, optimized cooling, and preventive maintenance. Production data should guide each decision, not assumptions. A machine that appears efficient may still consume excessive energy during short, frequent stops.
Real factories are rarely perfect.
This guide connects operational experience with measurable energy performance. It considers electricity costs, production stability, product quality, carbon reduction, and worker safety. Smart controls can reduce waste, but poorly tuned systems may create temperature swings or rejected parts. That risk deserves attention. Renewable power, battery storage, and demand-response programs may also help, depending on local infrastructure and factory schedules. The strongest results usually come from disciplined monitoring, trained operators, and realistic targets. Energy savings should never be claimed without reliable baseline data. Progress can be uneven. That is normal. Careful review turns imperfect trials into stronger long-term practice.
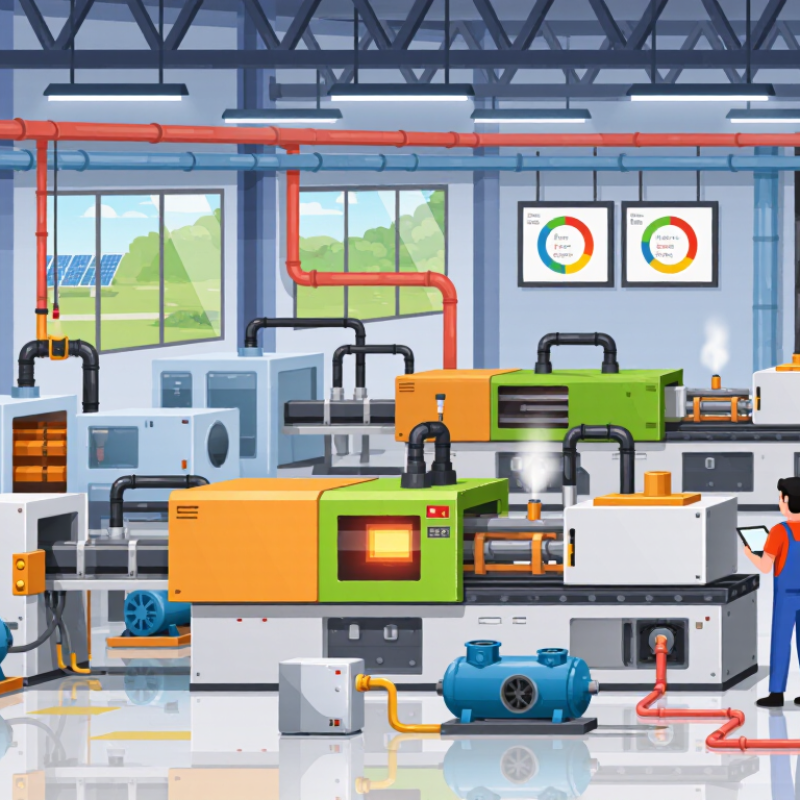
Energy management in plastic factories starts with knowing where energy goes. The International Energy Agency’s Energy Efficiency 2023 report states that industry uses about 37% of global final energy. Plastic production adds several demanding loads, including injection molding, extrusion, drying, cooling, and compressed air.
Measure before changing equipment. Install sub-meters around molding cells, chillers, dryers, and auxiliary systems. Track kilowatt-hours per kilogram of finished product, not only monthly electricity costs. Record production volume, resin type, machine settings, and ambient temperature. These details reveal hidden causes behind energy spikes. The U.S. Department of Energy’s Industrial Decarbonization Roadmap identifies energy efficiency as a practical foundation for reducing industrial emissions. Small corrections can matter.
Keep the baseline honest. A factory may appear efficient during steady production, yet waste energy during warm-up, idle periods, or short production runs. Check for leaking compressed air, overheated barrels, dirty filters, and poorly balanced cooling loops. Fix the simple faults first. Advanced controls should follow reliable data, not replace it. My own reflection is cautious: a dashboard can look impressive while operators still lack clear actions. Energy reviews should therefore include shift teams, maintenance records, and failed improvement trials. Imperfect data is common, but ignoring it is worse.
| Energy Management Strategy | Primary Factory Area | Recommended 2026 Action | Typical Energy-Saving Potential | Indicative Payback | Key Performance Indicator |
|---|---|---|---|---|---|
| Establish an energy baseline | Whole factory | Install sub-metering for molding, extrusion, compressed air, chilled water, HVAC, lighting and utilities. Normalize consumption by production volume and operating hours. | 5–15% from improved control and accountability | 6–24 months | kWh per kg of saleable product; peak kW; energy cost per production hour |
| Optimize injection-molding machines | Injection molding | Prioritize high-utilization machines for efficient hydraulic, hybrid or all-electric technology during scheduled replacement. Reduce idle time and optimize process settings without compromising quality. | 10–50% for machine electricity use when replacing inefficient hydraulic equipment | 2–6 years | Machine kWh per kg; kWh per cycle; first-pass yield; idle minutes per shift |
| Improve extrusion heating efficiency | Extrusion lines | Insulate heated barrels, dies and adapters; repair damaged insulation; tune temperature zones; and use automatic controls to prevent overheating during stoppages. | 5–20% of extrusion heating energy | 3–18 months | Heater kWh per kg; barrel surface temperature; temperature deviation from setpoint |
| Reduce compressed-air losses | Pneumatic equipment and utilities | Conduct ultrasonic leak surveys, repair leaks, eliminate inappropriate open blowing, lower system pressure where practical, and shut off unused branches during non-production periods. | 10–30% of compressed-air system energy | 3–12 months | Compressor kWh per operating hour; system pressure; leak loss percentage |
| Sequence and control compressors | Compressed-air room | Use a central controller, match compressor capacity to demand, avoid running multiple units at part load, and use variable-speed control for applications with changing demand. | 5–15% of compressor energy | 1–3 years | Specific power in kW per m³/min; unloaded running hours; discharge pressure |
| Optimize chilled-water systems | Process cooling and mold temperature control | Clean heat exchangers, maintain correct water flow, reset chilled-water temperature according to process requirements, and sequence chillers and pumps according to load. | 10–25% of cooling-system energy | 1–4 years | COP; kWh per ton-hour of cooling; supply and return temperature difference |
| Apply variable-speed drives | Pumps, fans, cooling towers and ventilation | Use variable-speed drives where flow or pressure varies, while verifying motor compatibility, minimum-speed limits, harmonics and process-control requirements. | 20–50% for suitable variable-load fan and pump applications | 1–3 years | Motor kWh; flow or pressure stability; average operating speed |
| Recover and reuse process heat | Extrusion, drying, compressors and thermal systems | Recover heat from compressor aftercoolers, hot process exhaust or cooling systems for space heating, combustion-air preheating or domestic hot water where demand is simultaneous. | 5–20% of replacement heating energy | 2–5 years | Recovered kWh; useful heat delivered; annual fuel displacement |
| Control drying and dehumidification | Resin drying and material preparation | Match drying temperature, airflow and dew point to resin requirements; avoid drying material unnecessarily; maintain filters, seals and regeneration controls. | 10–30% of dryer energy | 6–24 months | Dryer kWh per kg; dew point; moisture content at machine inlet |
| Manage peak electrical demand | Electrical distribution and production scheduling | Schedule non-critical loads outside tariff peak periods, stagger machine start-ups, limit simultaneous high-load heating, and use demand alerts before contract capacity is exceeded. | 5–15% reduction in peak demand charges | 3–18 months | Monthly peak kW; load factor; demand-charge cost per month |
| Modernize lighting and controls | Production halls, warehouses and offices | Replace inefficient lighting during planned maintenance, use occupancy or daylight controls where suitable, and maintain required illumination levels for quality and safety. | 30–60% of lighting energy | 1–3 years | Lighting kWh per m²; operating hours; maintained illuminance |
| Integrate onsite renewable electricity | Roofs, carports and electricity supply | Assess solar generation against daytime load, roof condition, structural capacity, interconnection limits, fire requirements and battery economics before investment. | Site-specific; commonly offsets 5–30% of annual electricity use | 5–12 years | Renewable kWh; self-consumption rate; avoided grid electricity |
| Use an ISO 50001-aligned management system | Energy governance and continuous improvement | Assign energy owners, define significant energy uses, set measurable targets, verify savings, include energy in procurement decisions and review performance at management level. | 3–10% from sustained operational improvement | 6–24 months | Energy intensity trend; completed actions; verified annual savings; audit findings |
Data note: Savings and payback figures are practical planning ranges drawn from common industrial energy-efficiency applications. Actual results depend on machine condition, production mix, operating schedule, utility tariffs, climate, process requirements and project design. Energy intensity should be calculated using saleable output and normalized for production volume and operating hours.
A single factory meter hides different loads. Track energy from pellet storage to finished parts. Include drying, extrusion, molding, cooling, compressed air, and material handling.
Record electricity, fuel, steam, cooling water, production volume, and operating hours. Note idle machines, weekend production, and overnight dryer operation. The map was incomplete.
Use kilowatt-hours per tonne of saleable resin or finished parts. This connects energy use with actual output. Monthly utility totals alone can mislead.
Install separate meters for extruders, molds, and other heating zones. Compare heat demand with cycle times, moisture readings, and scrap rates. Lower energy use may increase defects.
Small leaks can operate through every shift. Inspect hoses, fittings, pressure levels, and idle equipment. A quiet leak still consumes energy.
Measure temperature, flow, runtime, and load conditions. A chiller may cycle during maintenance or low production. Assumptions are not enough.
Track energy cost per tonne, peak-demand charges, and costs by production line. Use fifteen-minute meter data and verified invoices. Lower kilowatt-hours may still increase costs during expensive hours.
Report kilograms of carbon dioxide equivalent per tonne. Separate direct fuel emissions from purchased electricity. Review results monthly and verify them quarterly with calibrated meters.
Yes. Recycled-content processing can change heat demand, moisture levels, and quality losses. Compare similar products under similar operating conditions. The baseline may be wrong at first.
In 2026, effective Plastic Factory Energy Management Strategies begin with understanding where energy is used throughout production, from material preparation and molding to finishing and facility operations. Mapping consumption across each process helps factories identify avoidable losses and prioritize improvements based on operational needs. Smart monitoring can provide timely information about electricity, heat, cooling, and compressed-air use, while automated controls help adjust equipment operation to changing production demand.
Factories can also improve performance by maintaining and optimizing machinery, heating and cooling systems, and compressed-air networks. Practical measures include reducing idle operation, matching equipment settings to production requirements, and addressing heat or air losses. Progress should be evaluated with clear metrics that track energy use, operating costs, and associated emissions. Regular reviews of these results can show whether changes are effective and guide further improvements, supporting more efficient production without compromising product quality or reliability.