Zhida Plastic Machinery
How to Improve Plastic Manufacturing Productivity? This question reaches far beyond faster machines or larger production targets. In a molding plant, productivity can decline through small losses: a twelve-minute mold change, unstable barrel temperature, short material shortages, or repeated quality checks. These details accumulate across every shift.
Plastic Manufacturing Productivity Improvement begins with reliable observation. Measure overall equipment effectiveness, cycle time, scrap rate, downtime, energy use, and labor effort. Walk the production floor. Watch an operator change a mold, load resin, or remove a rejected part. The spreadsheet may look efficient. The work area may tell another story.
W. Edwards Deming, a leading authority in quality and manufacturing management, said, “If you can't describe what you are doing as a process, you don't know what you're doing.” His warning remains valuable for plastics manufacturers. Standard work, preventive maintenance, process control, and employee training should connect as one operating system.
Small gains matter.
A two-second cycle reduction can become thousands of additional parts each month. Yet speed alone can create more flash, warpage, or hidden rework. That is where many improvement programs become incomplete. They celebrate output, but overlook consistency, safety, energy consumption, and customer complaints.
This guide examines practical methods for improving productivity without treating workers as replaceable components. It considers machine data, material handling, mold design, scheduling, automation, and continuous improvement. Some recommendations may not suit every factory. That limitation deserves honesty. A disciplined trial, measured over several shifts, is often more trustworthy than a confident promise.
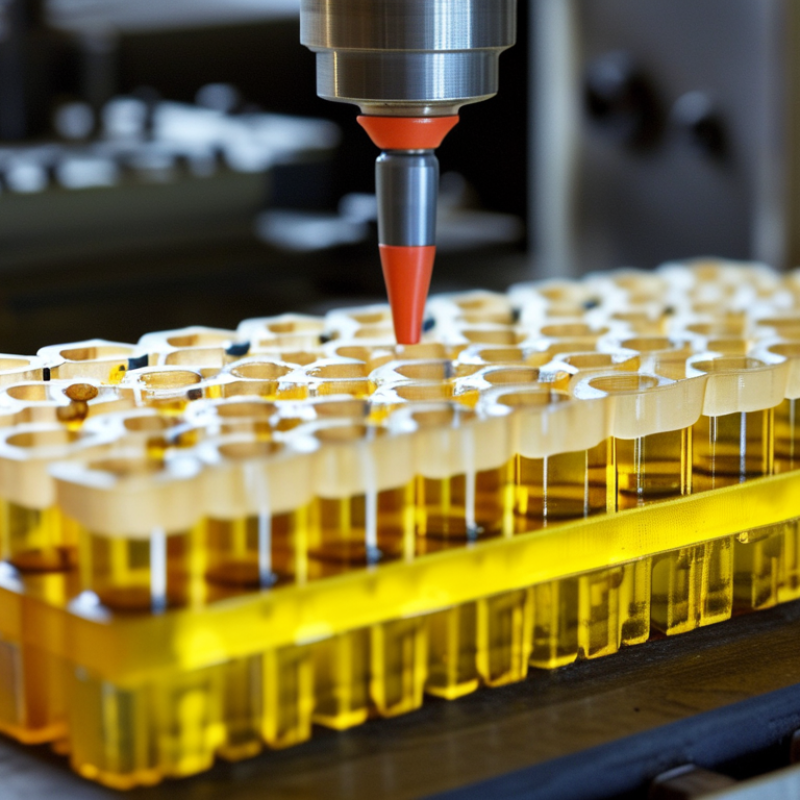
Before improving productivity, assess what the operation actually produces each shift. Walk through molding, material handling, trimming, inspection, and packing. Record cycle time, machine availability, output, scrap, changeover duration, and unplanned stops. Compare actual results with approved production standards, not optimistic estimates. A machine may run quickly yet create excessive rejected parts. That is hidden loss. Speak with operators during normal and difficult shifts. Their observations often reveal cooling delays, feeder issues, awkward tooling, or repeated minor stops.
Use a simple productivity baseline for each machine and product family. Overall equipment effectiveness can help, but only when data is accurate. Separate planned downtime from breakdowns. Track good parts, not total pieces. Check whether labor hours, energy use, and material waste rise during changeovers. A spreadsheet is sufficient at the beginning. However, manual records can contain gaps. Verify them against machine counters, quality logs, and maintenance reports. Review one full week, then investigate unusual days instead of deleting them. Those exceptions may show the real constraint. Do not blame people before checking process design.
Tips: Assign one person to collect data consistently. Use the same definitions across shifts. Photograph recurring defects and note their exact time. Measure waiting, not only running. Ask operators what they would change first. Test one improvement at a time, and record the result. If productivity falls, treat it as evidence, not failure.
Assess the Current Productivity of a Plastic Manufacturing Operation
The baseline assessment shows an overall equipment effectiveness of 68%. Availability and performance are the main improvement opportunities, while first-pass quality is comparatively stronger. Reducing unplanned downtime, shortening changeovers, and improving cycle-time consistency can help increase productivity.
Plastic productivity starts before resin reaches the hopper. Production planning should connect confirmed orders, mold availability, drying time, and realistic cycle data. Plastics Europe reported global plastics production at 400.3 million tonnes in 2022. Small planning errors can therefore create large material and scheduling losses. Use finite-capacity scheduling instead of optimistic spreadsheets. Leave space for mold changes, quality checks, and unplanned stops. A clean visual board near the production cell helps operators see the next job, resin, color, and packaging requirement.
Material flow needs equal attention. Store frequently used resin close to the correct dryer, but protect it from moisture and contamination. Color-coded containers, labeled return paths, and fixed staging zones reduce searching and unnecessary forklift movement. The U.S. Department of Energy reports that compressed-air systems can lose 20–30% of their output through leaks and poor practices. Similar waste appears when hot runners, dryers, or conveyors run without a confirmed job. Measure kilograms per hour, scrap percentage, waiting minutes, and energy per kilogram.
Equipment utilization is not the same as running every machine continuously. Track actual production time against planned available time, including changeovers and minor stops. An 85% OEE level is commonly cited as a world-class reference, but it should not become a blind target. Faster cycles can increase defects. I have seen teams chase utilization while ignoring unstable cooling water and worn molds. Daily checks should include temperature stability, pressure trends, lubrication, and alarm history. Some lessons are uncomfortable. A machine may look busy while producing the wrong parts.
How to Improve Plastic Manufacturing Productivity?
Improve Process Control, Automation, and Workforce Efficiency
Plastic productivity starts with stable process control. In an injection molding cell, operators should monitor melt temperature, pressure, cooling time, and cycle variation. A small temperature drift can create flash, short shots, or uneven shrinkage. The U.S. Department of Energy’s Industrial Decarbonization Roadmap reports that process heating represents about 51% of energy use in U.S. manufacturing. Better control can therefore support both quality and energy discipline. Simple alarms help, but poorly configured alarms create noise. That problem is often underestimated.
Automation should remove repetitive movement, not remove human judgment. The International Federation of Robotics’ World Robotics 2024 report recorded 541,302 industrial robot installations worldwide in 2023. Plastic plants can apply robots to part removal, inspection, packaging, and pallet handling. However, automation fails when changeovers remain informal. Record actual mold settings, cooling times, and defect patterns after every shift. Use this information to build reliable standard work. Train operators to understand the process, not just press buttons. Short lessons beside the machine work better than occasional classroom sessions. We still overtrust dashboards. A clean display cannot correct a leaking cooling line or unclear responsibility. Supervisors should review first-pass yield, unplanned downtime, and changeover loss daily, then question unusual results instead of accepting averages.
Plastic manufacturing productivity improves when loss becomes visible. The OECD’s Global Plastics Outlook reports 353 million tonnes of plastic waste in 2019, with only 9% recycled. That scale makes scrap control an operating priority, not a sustainability slogan. Track resin loss by machine, mold, shift, and startup cycle. Weigh purge, rejected parts, and floor sweepings separately. A clear defect code shows whether warpage begins with moisture, temperature, or cooling time. Keep the record honest. Our first dashboard was wrong because regrind was counted twice.
Downtime often hides in small stops. Record every interruption, even a 90-second nozzle clean. Then rank causes by lost minutes, not by opinion. Check mold alignment, heater response, material drying, and changeover tasks during each shift. The U.S. Department of Energy reports that compressed-air leaks can waste 20–30% of compressor output. Ultrasonic leak checks and pressure reduction can cut invisible energy waste. Measure kilowatt-hours per kilogram beside production output. A faster cycle is not productive if it creates more rejects.
Energy reduction must protect consistency. Insulate hot runners, maintain cooling-water flow, and remove unnecessary idle heating. The International Energy Agency identifies industry as using about 37% of global final energy, making process efficiency significant beyond the factory floor. Review the numbers weekly with operators. Targets can also mislead. A low scrap rate may hide delayed quality checks, while lower energy use may reflect slower production. Real improvement needs fewer defects, less waste, shorter downtime, and stable output at the same time.
| Productivity Dimension | Operational KPI | Typical Baseline | Practical Improvement Target | Recommended Improvement Measures | Expected Business Impact |
|---|---|---|---|---|---|
| Defects | Scrap and rework rate | 4%–8% of production output | Below 3% | Standardize process windows; verify mold temperature, injection pressure, cooling time, and material moisture; use first-piece approval and hourly quality checks. | More saleable products, lower material losses, and fewer customer complaints. |
| Defects | First-pass yield | 85%–94% | Above 97% | Apply root-cause analysis to recurring defects such as short shots, flash, sink marks, warpage, discoloration, and weld lines. | Reduced rework labor and improved production-line capacity. |
| Material Waste | Material utilization | 92%–97% | Above 98% | Optimize runners and gates; control purging; separate clean, compatible regrind; prevent over-drying and contamination of resin. | Lower polymer consumption and reduced waste-disposal costs. |
| Material Waste | Changeover material loss | 1%–4% of monthly material usage | Below 1.5% | Use a documented changeover sequence, pre-stage tools and materials, define purge limits, and record loss by machine and product. | Shorter changeovers and improved material yield. |
| Downtime | Unplanned downtime | 5%–12% of scheduled time | Below 5% | Implement preventive maintenance for heaters, pumps, hydraulic systems, robots, dryers, chillers, and mold components; monitor abnormal vibration and temperature. | Higher equipment availability and more predictable delivery performance. |
| Downtime | Overall Equipment Effectiveness (OEE) | 60%–75% | Above 80% | Track availability, performance, and quality separately; review the largest six losses during daily production meetings. | More output from existing assets without immediately adding machines. |
| Downtime | Average changeover time | 45–120 minutes | Reduce by 25%–50% | Apply SMED principles, move internal tasks outside the stoppage window, use quick-connect utilities, and standardize mold and tooling setup. | More available production time and greater scheduling flexibility. |
| Energy | Specific energy consumption | 0.7–1.5 kWh/kg for many injection-molding operations | Reduce by 10%–20% | Use efficient drives; optimize barrel, mold, and hot-runner temperatures; prevent compressed-air leaks; maintain dryers, chillers, and cooling circuits. | Lower electricity costs and reduced greenhouse-gas emissions per kilogram produced. |
| Energy | Compressed-air leakage | 20%–30% of compressor output in poorly maintained systems | Below 10% | Perform ultrasonic leak surveys, repair damaged hoses and fittings, lower system pressure where possible, and shut down idle branches. | Lower compressor power consumption and improved pneumatic reliability. |
| Productivity | Production throughput | Measured by good parts per hour | Increase by 10%–20% | Balance cycle time, reduce minor stops, optimize cooling, maintain consistent material feed, and eliminate bottlenecks in inspection and packing. | Higher output using the existing workforce and equipment base. |
| Process Control | Critical parameter compliance | Variable unless electronically monitored | Above 95% of cycles within approved limits | Define validated operating windows and automatically record pressure, temperature, cycle time, cooling time, and material-drying conditions. | More stable quality and faster detection of process drift. |
| Workforce | Standard-work adherence | Often inconsistent between shifts | Above 95% compliance | Use visual work instructions, operator certification, layered process audits, and shift-to-shift handover checklists. | Lower variation, faster onboarding, and more consistent performance across shifts. |
| Use of the table: Baseline values are practical industry reference ranges rather than company-specific results. Actual performance should be calculated from machine records, quality reports, utility meters, maintenance logs, and material-consumption data over a representative production period. | |||||
| Measurement guidance: OEE = Availability × Performance × Quality. Specific energy consumption = Total production energy consumed ÷ Good production weight. Scrap rate = Scrap weight ÷ Total material input. | |||||
Plastic manufacturing productivity improves when performance becomes visible on the shop floor.
Track output, cycle time, scrap rate, energy use, and unplanned downtime. A dashboard should show trends by machine, mold, material, and shift. Numbers alone are not enough. Operators need context. A ten-minute stoppage may reveal a cooling problem, a material change, or a training gap. Record the reason beside the duration. This turns isolated events into usable evidence. Keep measurements consistent. Use calibrated instruments and clear definitions for every metric.
Review performance during short daily meetings near the production area. Compare actual cycle times with standard settings, not ideal assumptions. Watch for small losses, such as repeated nozzle cleaning or slow mold changes. They often consume more capacity than one dramatic breakdown. Verify improvements across several batches. Check dimensions, appearance, weight, and rejection records before increasing speed. Quality must remain stable. A faster press that creates warped parts is not productive.
Continuous improvement also requires honest reflection. Some experiments will fail. Others may improve one shift while harming another. Teams sometimes adjust temperature settings without checking humidity, material moisture, or cooling water flow. The result may look promising for two hours, then scrap increases. Document successful and unsuccessful trials. Assign owners, deadlines, and follow-up checks. Protect time for maintenance and operator feedback. Do not hide missing data. A gap in the log may be the clearest signal that the process is not yet under control.
: Connect confirmed orders, mold availability, drying time, and realistic cycle data. Use finite-capacity scheduling. Leave room for mold changes, quality checks, and unexpected stops. A visual board should show the next job, resin, color, and packaging needs.
Store frequently used resin near the correct dryer. Protect it from moisture and contamination. Use colored containers, labeled return paths, and fixed staging areas. These details reduce searching and unnecessary forklift movement.
No. Continuous running can hide defects, waste, and unstable processes. Measure actual production time against planned available time. Include changeovers and minor stops. A busy machine may produce incorrect parts.
Check temperature stability, pressure trends, lubrication, and alarm history. Inspect cooling-water flow and mold condition. Fast cycles are not useful when worn molds create warped parts. Speed can deceive.
Track resin loss by machine, mold, shift, and startup cycle. Weigh purge, rejected parts, and floor sweepings separately. Use defect codes for moisture, temperature, cooling, and alignment problems. Keep regrind records separate. Our dashboard may be wrong if regrind is counted twice.
Record every interruption, including a 90-second nozzle cleaning. Rank causes by lost minutes, not personal opinion. Review mold alignment, heater response, drying, and changeover tasks. Small stops often consume more capacity than one major breakdown.
Check compressed-air leaks with suitable leak-detection equipment. Reduce unnecessary pressure and idle operation. Insulate hot runners and maintain stable cooling-water flow. Measure kilowatt-hours per kilogram beside production output. Lower energy use alone proves little.
Track output, cycle time, scrap rate, energy use, and unplanned downtime. Show trends by machine, mold, material, and shift. Record the reason beside each stoppage. Review results near the production area each day. Numbers need context.
Test changes across several batches before increasing speed. Check dimensions, appearance, weight, and rejection records. Document successful and unsuccessful trials. Assign owners, deadlines, and follow-up checks. Missing data matters.
Improving plastic manufacturing productivity begins with a clear assessment of the entire operation, including output, cycle times, equipment availability, labor performance, material usage, and overall production costs. This evaluation helps identify bottlenecks and establishes measurable priorities. Production planning should then be improved through accurate demand forecasting, balanced scheduling, efficient material flow, and better equipment utilization. Organizing workstations and reducing unnecessary movement can also improve throughput and consistency.
Effective Plastic Manufacturing Productivity Improvement requires strong process control, appropriate automation, and continuous workforce training. Standardized procedures, real-time monitoring, and preventive maintenance can reduce defects, waste, unplanned downtime, and excessive energy consumption. Manufacturers should track key performance indicators such as productivity, yield, downtime, quality rates, and energy use. By reviewing these results regularly, identifying root causes, and applying corrective actions, a plastic manufacturing operation can achieve safer, more stable, cost-efficient, and sustainable long-term performance.