Zhida Plastic Machinery
Plastic Industry Market Trends Analysis examines how production, demand, technology, regulation, and environmental pressure reshape a global industry. It connects factory-level changes with consumer behavior and investment decisions. The market is large, but its direction is not simple.
Grand View Research estimated the global plastics market at approximately USD 712.6 billion in 2023. Its report also projects continued growth through 2030, supported by packaging, construction, healthcare, and automotive demand. However, growth alone does not show market quality. The OECD’s Global Plastics Outlook reported 460 million tonnes of global plastic production in 2019. It also found that only 9% of plastic waste was ultimately recycled. Those figures expose a difficult gap between production speed and recovery capacity.
Roland Geyer, an industrial ecologist at the University of California, Santa Barbara, warned, “We cannot recycle our way out of the plastic waste problem.” His statement gives this analysis a necessary reality check. Recycling technology matters, but so do material design, collection systems, energy use, and purchasing habits. UNEP’s Turning off the Tap report suggests that plastic pollution could be reduced substantially by 2040 through reuse, recycling, and redesigned products. The outlook remains promising, yet imperfect. Feedstock prices can change quickly. Policy signals can also confuse investors. A credible Plastic Industry Market Trends Analysis must therefore compare market expansion with measurable circularity, regional differences, and operational risks. This approach helps readers see both the opportunity and the uncomfortable limits behind industry forecasts.
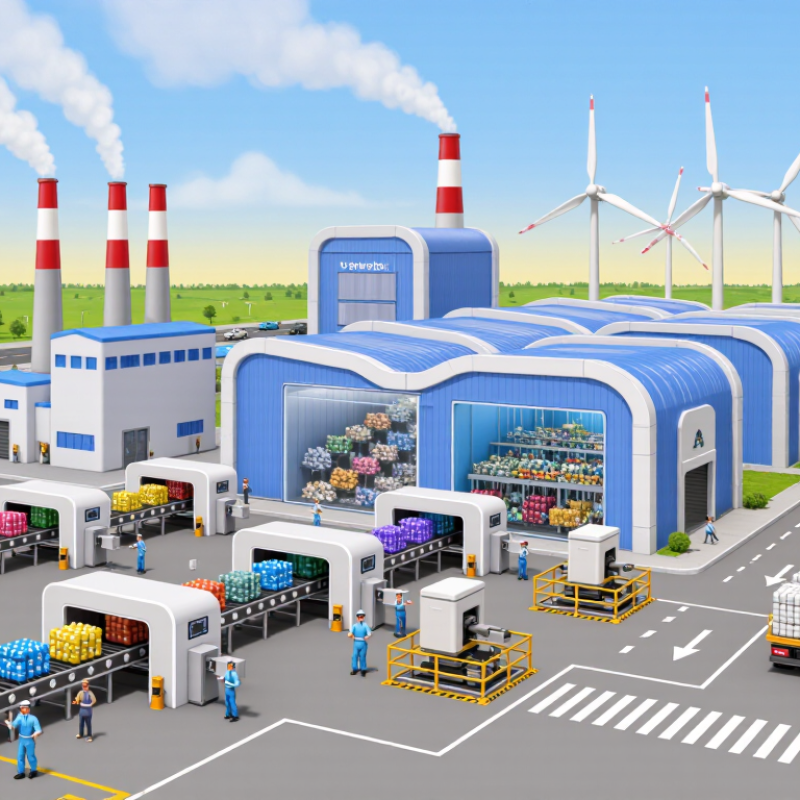
Plastic industry market trends analysis is the structured study of how the plastic market changes over time. It examines demand, supply, pricing, production capacity, and customer behavior. The scope includes raw materials, processing technologies, finished products, and end-use sectors. Packaging, construction, healthcare, electronics, and transportation may show different growth patterns. A useful analysis connects these areas instead of treating plastic as one uniform market.
Analysts often compare sales volumes, import data, factory output, and resin price movements. They may also interview processors, distributors, engineers, and purchasing managers. A factory order book can reveal demand earlier than public statistics. A sudden shift in material costs can change product designs within weeks. Regional analysis matters because infrastructure, recycling systems, and manufacturing capacity differ widely. Regulatory requirements can also influence material selection and production planning.
The analysis should include both current conditions and possible future scenarios. Forecasts may consider lightweight products, recycled inputs, automation, and changing consumer preferences. However, data is rarely perfect. Small manufacturers may report late, while informal demand remains difficult to measure. Forecasts can also miss energy shocks or sudden supply disruptions. This limitation deserves attention. Reliable research explains its sources, tests competing assumptions, and separates verified evidence from professional judgment.
| Analysis Dimension | Definition or Scope | Verified Market Indicator | Trend Interpretation | Reference |
|---|---|---|---|---|
| Market Definition | The systematic study of production, consumption, trade, pricing, applications, technologies, regulation, and circularity across the plastics value chain. | The market is commonly measured by volume, value, resin type, product form, application, geography, and time period. | A complete analysis combines demand-side, supply-side, policy, technology, and environmental indicators rather than relying on sales value alone. | OECD; United Nations Environment Programme |
| Global Production Volume | Total annual production of plastics, generally reported in million tonnes and covering fossil-based and, where specified, recycled plastics. | 413.8 million tonnes of global plastics production in 2023. | Global output increased from approximately 400.3 million tonnes in 2022, indicating continued long-term expansion in material demand. | Plastics Europe, Plastics – the Fast Facts 2024 |
| Polymer and Resin Scope | Analysis may cover polyethylene, polypropylene, polyvinyl chloride, polystyrene, polyethylene terephthalate, engineering plastics, thermosets, and elastomers. | Polyethylene, polypropylene, polyvinyl chloride, and polyethylene terephthalate are among the principal high-volume thermoplastics used in packaging, construction, transport, and consumer products. | Commodity polymers support scale, while engineering polymers and high-performance materials are assessed through application growth, performance requirements, and value per tonne. | European Chemicals Agency; OECD |
| End-Use Application | Demand is segmented by packaging, construction, automotive and mobility, electrical and electronics, agriculture, healthcare, textiles, and consumer goods. | Packaging is the largest global end-use category in many industry datasets because plastics provide lightweighting, barrier protection, durability, and low-cost conversion. | Growth is influenced by urbanization, food and healthcare requirements, infrastructure investment, lightweighting, and substitution between materials. | OECD; UNEP; European Commission |
| Recycling and Circularity | This dimension measures collection, sorting, mechanical recycling, chemical recycling, recycled content, reuse, and the final treatment of plastic waste. | Approximately 9% of global plastic waste was ultimately recycled in 2019. | Low global recycling performance creates growth opportunities for collection systems, design-for-recycling, recycled materials, reuse models, and improved sorting technologies. | OECD, Global Plastics Outlook, 2022 |
| Waste Generation | The analysis includes the quantity of plastic waste generated, waste composition, collection coverage, treatment pathways, and leakage into the environment. | 353 million tonnes of plastic waste were generated globally in 2019, according to the OECD estimate. | Waste generation is closely linked to consumption growth, short-lived products, packaging intensity, population growth, and the effectiveness of waste-management systems. | OECD, Global Plastics Outlook, 2022 |
| Regional Coverage | Geographic analysis normally compares Asia-Pacific, Europe, North America, Latin America, the Middle East, and Africa using production, consumption, trade, and policy data. | Asia accounted for approximately 51.2% of global plastics production in 2023. | Regional differences reflect manufacturing capacity, population, industrialization, petrochemical feedstock access, infrastructure, and regulatory conditions. | Plastics Europe, Plastics – the Fast Facts 2024 |
| Trade and Supply Chain | Scope includes feedstocks, monomer and polymer production, international trade, converting, logistics, inventories, and supply disruptions. | Key trade indicators include import and export value, physical tonnage, trade balance, tariff exposure, shipping costs, and feedstock availability. | Supply-chain analysis helps identify exposure to energy prices, regional capacity changes, geopolitical risks, transport disruptions, and material shortages. | UN Comtrade; International Energy Agency |
| Regulation and Policy | This covers product standards, extended producer responsibility, recycled-content targets, single-use restrictions, waste-export rules, and chemical regulations. | The United Nations Environment Assembly adopted a resolution in 2022 to develop an international legally binding instrument addressing plastic pollution. | Policy increasingly affects product design, material selection, labeling, packaging formats, recycling economics, and producer obligations. | United Nations Environment Programme, 2022 |
| Environmental and Climate Indicators | Relevant indicators include greenhouse-gas emissions, energy use, fossil-feedstock demand, leakage, microplastics, resource efficiency, and life-cycle impacts. | The plastics life cycle generated approximately 1.8 billion tonnes of greenhouse-gas emissions in 2019, about 3.4% of global emissions. | Decarbonization analysis increasingly compares virgin production, recycled materials, reuse systems, electrification, renewable feedstocks, and waste-treatment options. | OECD, Global Plastics Outlook, 2022 |
| Forecast and Scenario Analysis | Forecasts estimate future demand, capacity, prices, recycling volumes, technology adoption, and policy impacts under defined assumptions. | A credible forecast should disclose its base year, market boundaries, price basis, currency, geographic coverage, assumptions, and sensitivity scenarios. | Scenario planning is especially important because regulation, circularity, energy prices, material substitution, and economic growth can materially change future outcomes. | OECD; International Energy Agency; national statistical agencies |
It examines demand, supply, prices, production capacity, and customer behavior. It also studies materials, processing methods, products, and end-use sectors.
Packaging, construction, healthcare, electronics, and transport need different performance standards. A food container may need barrier protection, while a vehicle part needs heat resistance and low weight.
Participants include material producers, compounders, converters, equipment suppliers, distributors, recyclers, and end users. Each stage adds cost and possible delays.
Analysts compare factory output, trade records, prices, capacity, sales, and recycling volumes. Interviews with engineers and purchasing managers add practical detail.
Yes. A factory order book may show demand before public statistics change. Still, small producers may report late.
A sudden cost increase can encourage lighter designs, different materials, or revised production plans. Changes may happen within weeks.
Data may use inconsistent reporting boundaries. Informal demand, seasonal buying, energy shocks, and supply disruptions can remain hidden.
Global plastic production was reported at about 460 million tonnes in 2019. Another estimate placed 2023 production near 414 million tonnes. The figures may not use identical methods.
Collection rates affect recovered material supply and future product planning. Estimates can be uncertain because local systems differ widely.
They should compare forecasts with local prices, shipment records, capacity data, and purchasing behavior. A polished model can still miss reality.
Plastic Industry Market Trends Analysis is the systematic study of changes in the plastic sector, including market size, product categories, regional demand, production capacity, pricing, and future growth opportunities. It examines major market segments such as packaging, construction, automotive, electronics, healthcare, and consumer products, while also considering the roles of raw material suppliers, manufacturers, processors, distributors, recyclers, and end users across the value chain.
Effective analysis combines information from public statistics, industry reports, trade data, company disclosures, surveys, and expert interviews with quantitative and qualitative research methods. Key forces shaping plastic demand and supply include population growth, urbanization, technological innovation, economic cycles, resource costs, environmental expectations, and evolving regulations. Businesses can use these insights to improve capacity planning, identify emerging applications, manage supply chain risks, develop more efficient materials and processes, and make informed decisions about investment, product development, sustainability, and long-term market positioning.